|
Objective: |
|
Implement, connected to the CLIENT's network structure,
a solution for monitoring traffic and WAN circuits status of the said network.
This solution includes equipment, software and services, all of them supplied by TMP Consultoria.
|
|
Standard Facilities: |
|
 User interface totally made by standard WWW browsers(Netscape, Explorer or other), allowing system
usage from any computer in the client's internal network.
User interface totally made by standard WWW browsers(Netscape, Explorer or other), allowing system
usage from any computer in the client's internal network.
Acess controlled by
username and password, with different acess levels for each user.
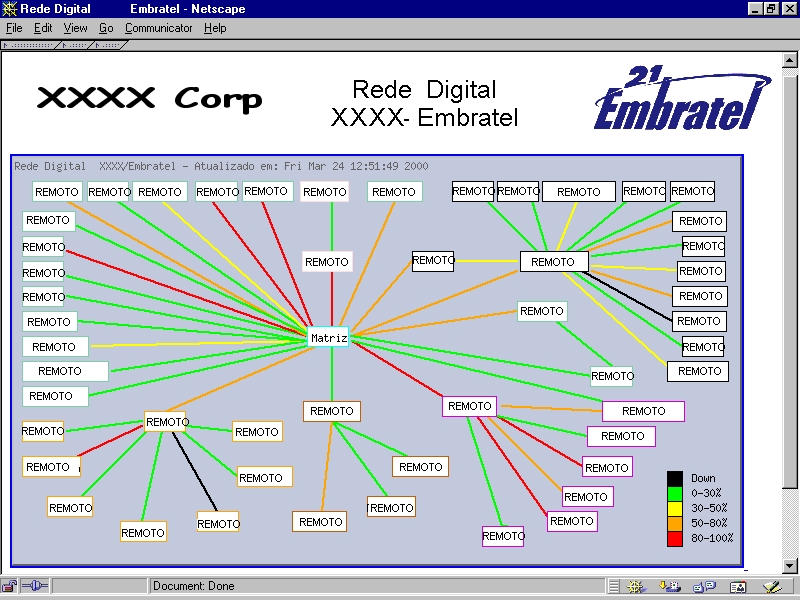
Overall view of the
whole WAN network of the client in a single screen, through a dynamic link and knot graphic, where
the links change their color according to traffic variation and each circuit's state, and that,
through mouse selection, allow the checking of detailed statistics per circuit(see items below);
[Click here to see Wanview's starting screen -
wanviewfront.jpg 327K
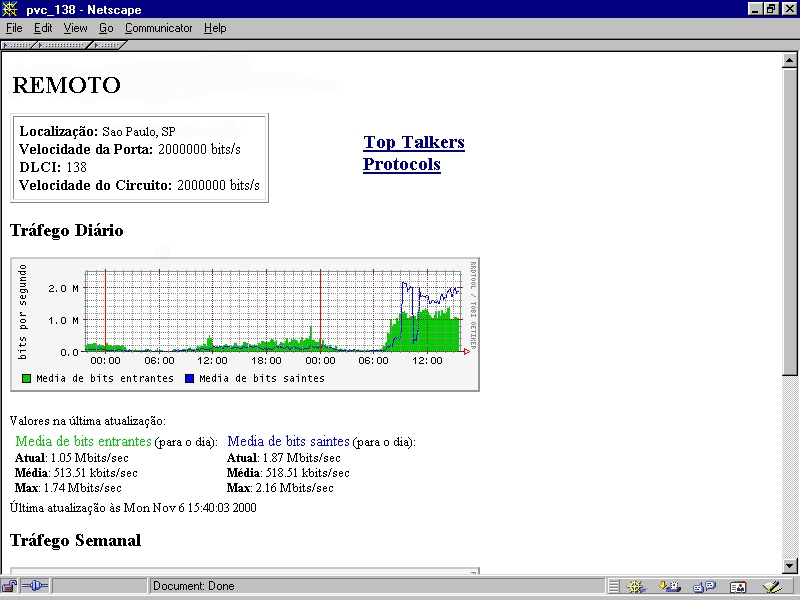
 On-line graphic usage report
which may be consulted at any time and that will show "usage tax X time" graphics along the
current day, week, month, or year. These graphics will show the average usage, the usage peaks
and valleys.
[Click here to see the usage graphics's screen -trafego.jpg 200K
] On-line graphic usage report
which may be consulted at any time and that will show "usage tax X time" graphics along the
current day, week, month, or year. These graphics will show the average usage, the usage peaks
and valleys.
[Click here to see the usage graphics's screen -trafego.jpg 200K
]
On-line, textual
usage report, which may be consulted anytime and which will list the "usage tax" of a
determined WAN network link at any given time;
Click here to know more about this report.
On-line disponibility
report which may consulted at any time and which will list all the interruptions that
happened at any given time on a determined WAN network link;
Click here to know more about this report.
Warning through pager of any
alteration in the circuits status.
The monitoration will be done
at the Client's environment, and the reports/graphics will be available on-line at all times for
the Client.
|
|
Optional Facilities: |
|
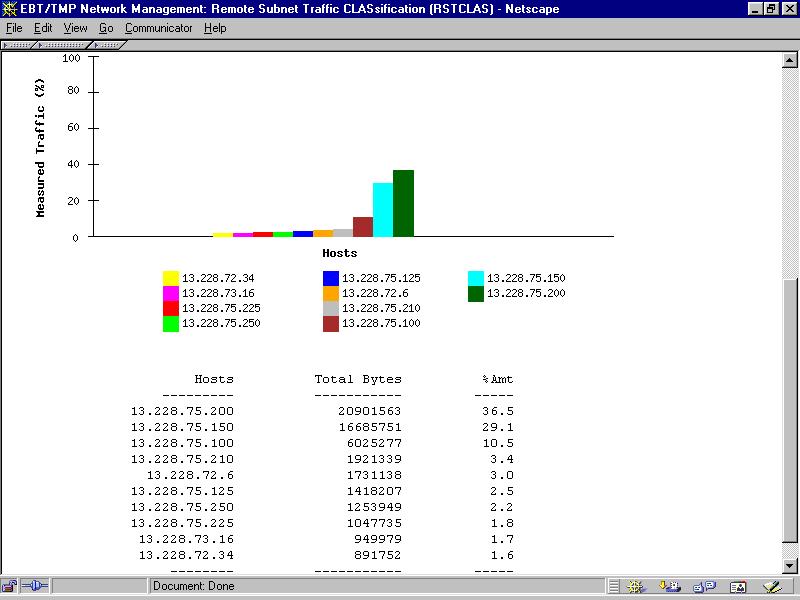
"Top-talkers" report, also available on-line, detailing at any given moment the "N" biggest users
of each channel along the current day, week, month and year. The value of "N" will be defined on
the system implementation. If the CLIENT wishes, an alarm may be installed which will ring in case
there is usage above a certain established limit.
[Click here to see the Top Talkers report screen -
rstclass.jpg 60K
On the above scren's example, it is visible that the 13.228.75.200,
13.228.75.150 and 13.228.75.100 hosts are responsible for using 76.1% of the analysed channel.
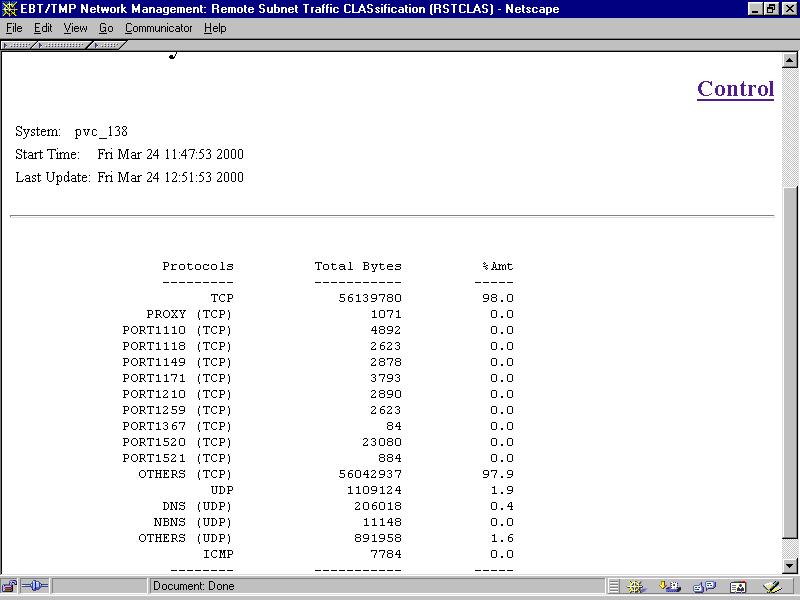
Protocol report, also on-line,
which details at any moment the percentual usage of each channel per protocol(IP, UDP, TCP, ICMP,
HTTP, NETBIOS, DNS and others) along the current day, week, month, and year. The protocol list to
be considered will be defined on system implementation.
[Click here to see the protocol report screen - rstclas2.jpg 64K
]
On the example, we see that 97,9% of this channel's usage is done by TCP protocols
which are not registered as "authorized" or "work" protocols. This information, along with the
Top Talkers report, helps locating the user of said channel and what kind traffic edxists on that
circuit.
|
|
Prerequisites: |
|
Access to the CLIENT's personnel to finish possible doubts regarding network topology and ????
configuration.
Access to a "read-only community" configured on the ????, for capturing the information
monitored through SNMP MIB II and, for optional facilities 1) e 2), same for RMON2. If the client
does not have RMON2 on his ????, TMP has developed a specific "probe" that makes capturing the
necessary information possible.
Infraestructure on the
CLIENT's for connecting the monitoring equipment: 1 energy point(110VAC, 200W), estabilized and
protected by no-break, 1 ethernet point, refrigerated environment with controled access.
|
